.svg)

Get started Alarmy
by scanning the QR code
by scanning the QR code

%201.svg)
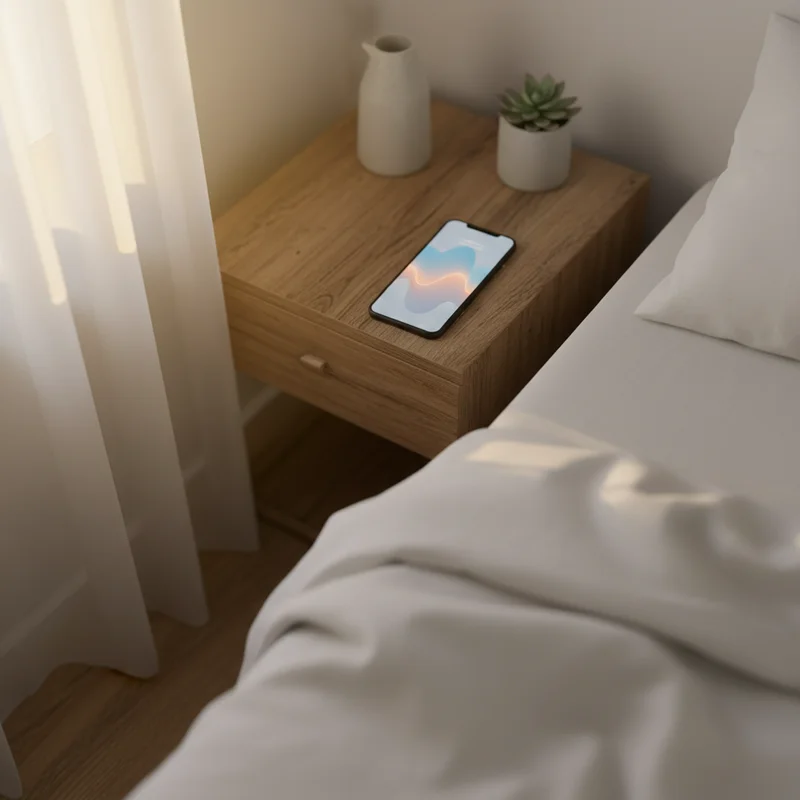
You slept seven hours. The bedroom was dark. You did not wake up in the middle of the night that you remember. And yet here you are at 10 AM, refilling coffee and rereading the same paragraph for the third time.
The honest answer is that "I slept well" is a feeling, not a measurement. People routinely rate a bad night as fine and a fine night as bad, especially after a busy day. Your gut-check is a noisy sensor.
That is what Alarmy's Sleep Report is for. Think of it the way you think of a kitchen scale during a diet: not magic, not a verdict, just a way to swap one fuzzy feeling for four objective numbers you can actually look at and discuss. Other trackers do this kind of thing too. This Alarmy sleep report guide is about how to read those numbers once you have them.
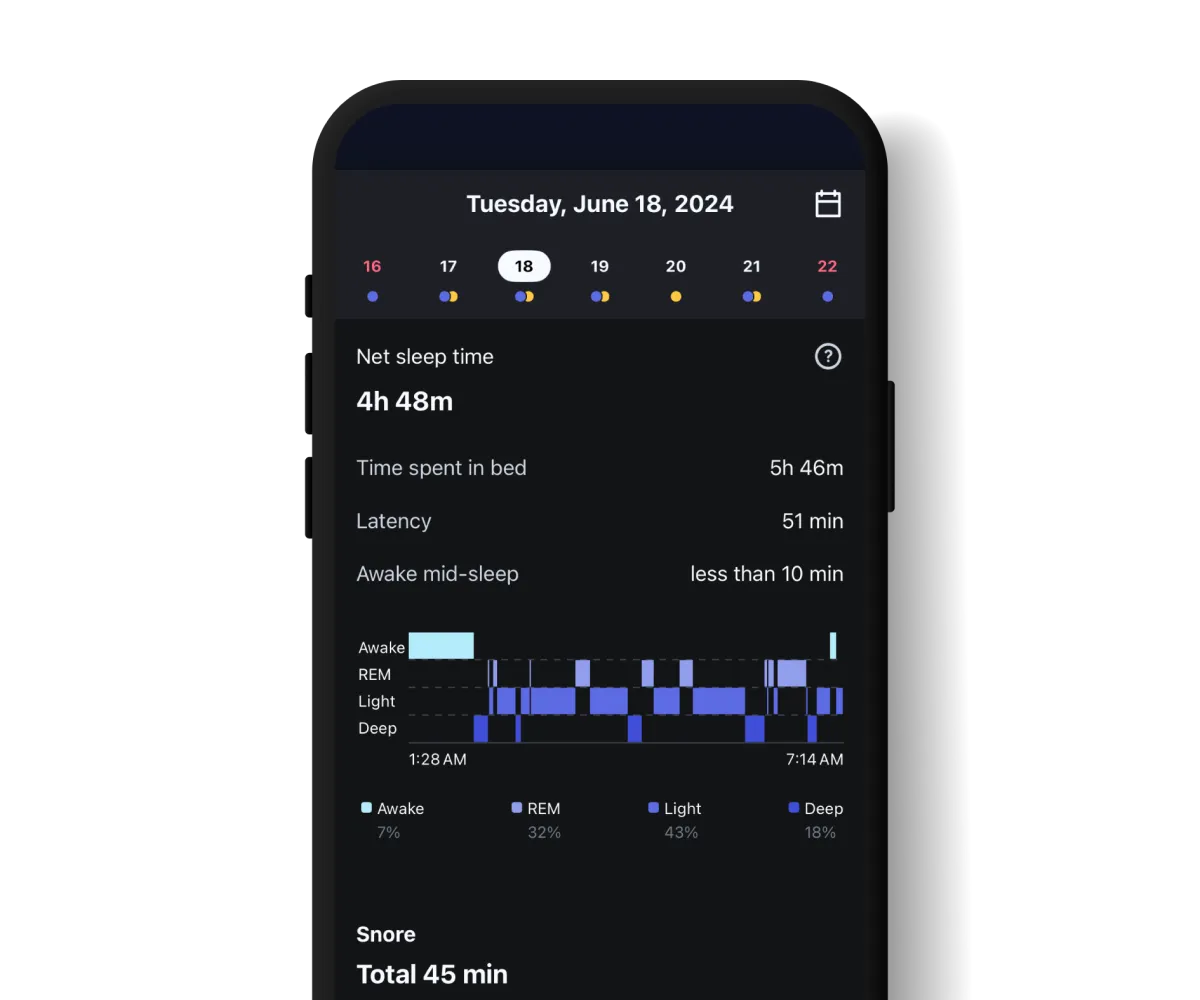
The Sleep Report shows four core numbers each morning. Each one answers a different question, and they only make sense when you read them together.
Most people overestimate this number. You go to bed at 11, you wake at 7, so you "got eight hours". But you scrolled for twenty minutes, took twelve minutes to fall asleep, and surfaced briefly around 4 AM. The report shows the actual asleep portion, which is often 30 to 60 minutes shorter than the in-bed window.
Sleep latency is the gap between lying down and falling asleep. Around 10 to 20 minutes is typical for adults. Consistently over 30 minutes is the signal that earns its own pattern below.
Deep sleep (slow-wave sleep) is the stage where physical recovery concentrates. For most adults it makes up roughly 13 to 23 percent of the night, per the Sleep Foundation. A low ratio is one of the more useful "why am I tired" clues, because total sleep time can look normal while this is quietly missing.
REM is when your brain processes memory and emotion. It also clusters in the later half of the night, which is why short sleep cuts disproportionately into REM, not deep sleep.
The report estimates these stages from breathing pattern changes captured by your phone's microphone, using Alarmy's own RespireSegNet model. The method is documented in an IEEE ICEIC paper. The takeaway: it is an estimate based on respiratory signal, not an EEG, so treat the numbers as a directional pattern rather than a clinical readout.
Your total sleep time is decent. Your stage ratios are inside the typical range. But your sleep latency runs 35, 40, sometimes 50 minutes night after night.
That is the slow-to-sleep profile, and it is one of the most common patterns in any tracker's data, not just Alarmy's. Likely culprits, roughly in order of how often they actually matter: a circadian rhythm pushed later than your alarm wants, residual caffeine from a 4 PM coffee, a high-stimulation pre-bed routine (work, news, hard scrolling), and ambient stress.
The fix is rarely "try harder to sleep". A more useful first move is to shift the caffeine cutoff earlier by two or three hours and watch the latency number over the next week. If that does not move the needle, audit bedroom light and temperature, then add a short breathing routine before lights-out. For a deeper walkthrough of the wind-down side, see our piece on how to fall asleep fast: the science.
You hit seven or eight hours. You did not wake up much. You still feel hollowed out. When you open the report, the total time looks fine but the deep sleep ratio sits under 10 percent.
This is the "slept enough, still tired" pattern. Quantity is there, but the restorative stage is short. The most common levers, all well documented in sleep literature, are alcohol within a few hours of bed, large late meals, and high-intensity workouts in the evening. Each one tends to compress slow-wave sleep, even when you fall asleep easily and stay down.
A practical move is to pick one of those three to remove for a week and re-check the deep sleep ratio. Resist the urge to fix everything at once, because then you cannot tell which lever did the work. If the deficit persists across weeks with clean habits, it is also worth reading how much deep sleep do you need to calibrate what "low" actually means for your age.
Pattern 3 shows up two ways at once. The hypnogram looks choppy, with multiple short awakenings. And the snoring recording, if it ran, shows irregular or repeatedly interrupted breathing.
This is the fragmented profile. The night is long enough on paper, but it is broken into pieces. The two big buckets are airway-related disruption (snoring, possibly apnea) and environmental disruption (noise, heat, a partner who moves a lot). Listening to the snoring clip yourself is a fast first check, and you usually know within thirty seconds whether something sounds off.
A clear note before going further: pattern signals are descriptive, not diagnostic. If the recording sounds like repeated breath stoppages, daytime sleepiness has stayed bad for weeks, or both, that belongs with a clinician, not a blog post. Our snoring causes and remedies walkthrough covers the in-between cases where lifestyle changes are still worth trying first.
The fastest way to misuse a sleep report is to react to a single night. Four small habits keep you out of that trap.
Once you can read the four metrics and recognize a pattern, the actual improvement step is small.
Pick one pattern. Change exactly one variable that targets it: bedtime, caffeine cutoff, or bedroom temperature, pick one. Hold everything else constant for seven days. Then reopen the report and compare the relevant metric (latency, deep sleep ratio, or fragmentation count) to the previous week's average.
If the variable moved the number in the right direction, keep it. If not, swap to the next candidate and run another week. The reason this works is boring and unglamorous: changing five things at once tells you nothing about which one helped. Single-variable testing is what turns the report from a passive dashboard into a feedback loop. Curious where REM fits in this loop? Our explainer on what is REM sleep covers the part most people skip.